Determining the Mathematical ROI of a Project Management Office (PMO) Implementation
Publications
PMI Global Congress 2013 – North America
New Orleans – Louisiana – USA – 2013
PMO Summit Brazil
Rio de Janeiro – RJ – Brazil – 2012
Abstract
The objective of this paper is to present, discuss and apply a mathematical model based on the use of Monte Carlo simulation in conjunction with researches on project success/failure rates of projects to develop a 10 step model to calculate the mathematical return on investment (ROI) for the Project Office implementation.
The paper aims to provide guidance on how intangible results resulting from the project planning and control can be linked to potential savings in time and cost comparing with projects poorly managed (KWAK & IBBS, 2000). It is not the scope of this paper to demonstrate the positive impact of good project management practices. The main objective is to discuss possible ways of measuring results in order to have a more clear cost benefit analysis regarding the value of a PMO Setup (HUBBARD, 2010).
This paper also discusses the main challenges to quantify benefits considering cultural, social and value perception dimensions in order to translate benefits into clear and measurable numbers.
The importance of clear benefit measurement
Business improvement processes like the Project Management Office implementation are, most of the time, linked to indirect benefits achievement. In the past, program, project, or process success was measured by activity: number of people involved, money spent, days to complete. Little consideration was given to the benefits derived from these activities because they were considered impossible to be clearly measured (PHILIPS & PHILIPS, 2007).
The intention of clear measurement of benefits can be based in the following arguments:
- Price/money is a proxy for value.
- Measurable outcomes contribute to a better alignment and integration with financial systems performance.
- More tangible results support the identification of critical sources of value.
- Promotes communication and makes results quantitatively tangible.
Understand the clear impact on project results of the project management processes, tools and existing support and how this structure contributes to better project results became a key driver to understand the value of project management (EIU, 2009)
Model Overview
The proposed model is based on 10 (ten) processes that are organized into 6 (six) groups (Exhibit 01). Both the processes and the groups are interrelated in order to produce the needed steps to understand the real costs and benefits brought by the Project Management Implementation.
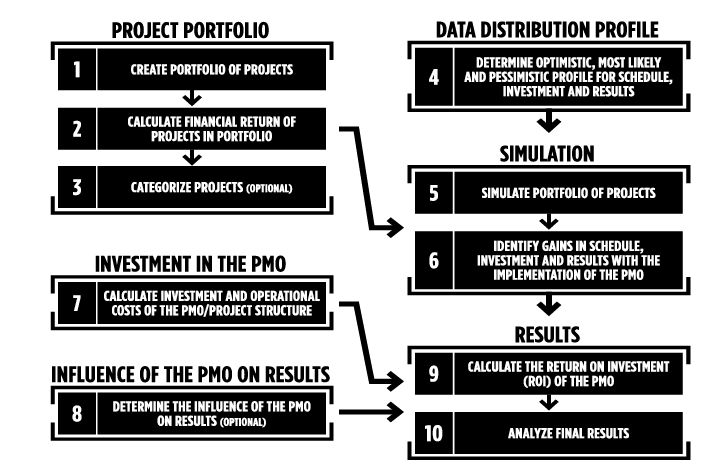 Exhibit 1 – 10 Processes to calculate the Return on Investment of a Project Management Office.
The processes are defined following the structure proposed by the PMBOK Guide (PMI, 2013) with Inputs, Tools and Techniques and Outputs.
Project Portfolio
The Project Portfolio group describes the process that should be in place to understand the scope of what should be managed by a potential Project Management Office (PMO). The intend is to make sure that the potential projects that will be supported by the project management office are identified and the cost, time frame and benefits (value) of these projects are calculated.
The Project Portfolio group is divided in the following processes
- Create the portfolio of projects
- Calculate financial return of projects in the portfolio
- Categorize projects
Create the Portfolio of Projects
This is process is responsible for the creation of the portfolio of projects. Based in working groups and the support of experts, it aims to create a list of the projects that will be managed by the PMO including some preliminary information like the Project objectives, estimated duration and budget (Exhibit 2).
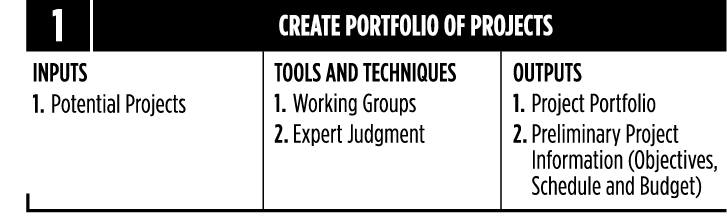 Exhibit 2 – Create Portfolio of Projects
The Project Portfolio can be presented in different ways but the most suitable to support the upcoming process is a list with the name of the project, estimated duration and budget (Exhibit 3). If the Project Office will support all kinds of projects at the corporate level, the list of projects can include a very different set of initiatives.
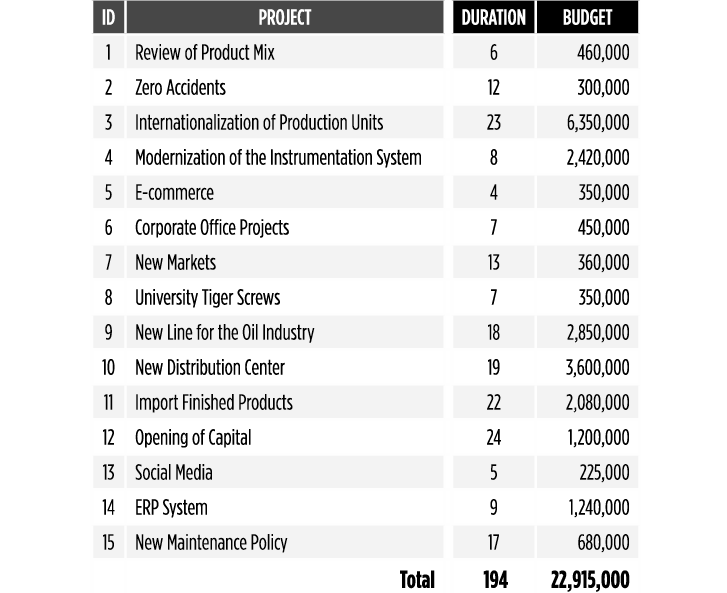 Exhibit 3 – Example of basic project list
The preliminary project information can include all supporting information about the project, including main objectives, outputs, expected benefits and basic scope (Exhibit 4). This preliminary information can be also called Project Brief or Outline Business Case (UK CABINET OFFICE, 2011)
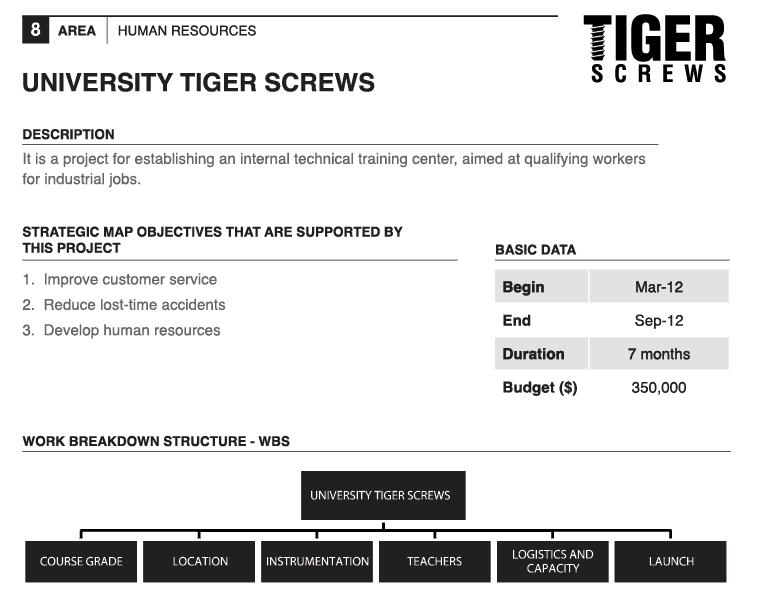 Exhibit 4 – Example of project preliminary information
Calculate Financial Return of Projects in the Portfolio
After identifying the potential portfolio of projects to be managed, it becomes important to calculate the benefits in terms of financial results of each project. This is one of the most challenging steps towards the calculation of the ROI of a Project office. Using the preliminary information, all proposed benefits will be measured in order to find clear outcomes (Exhibit 5).
 Exhibit 5 – Calculate Financial Return of Projects in the Portfolio
In some cases, this is easily measurable in terms of increase in the production, market place, etc. In other projects, the intangible results must be converted into an estimated final outcome. As an example, one main outcome of the “University Tiger Screws” project is to develop new capabilities in the current staff in order to reduce the investments with additional hiring of personnel. A range of potential savings is defined and through the pairwise comparison using the Analytic Hierarchy Process (SAATY, 1980, SAATY, 2009 and VARGAS, 2010), the Expected Value of the benefit could be estimated (Exhibit 6).
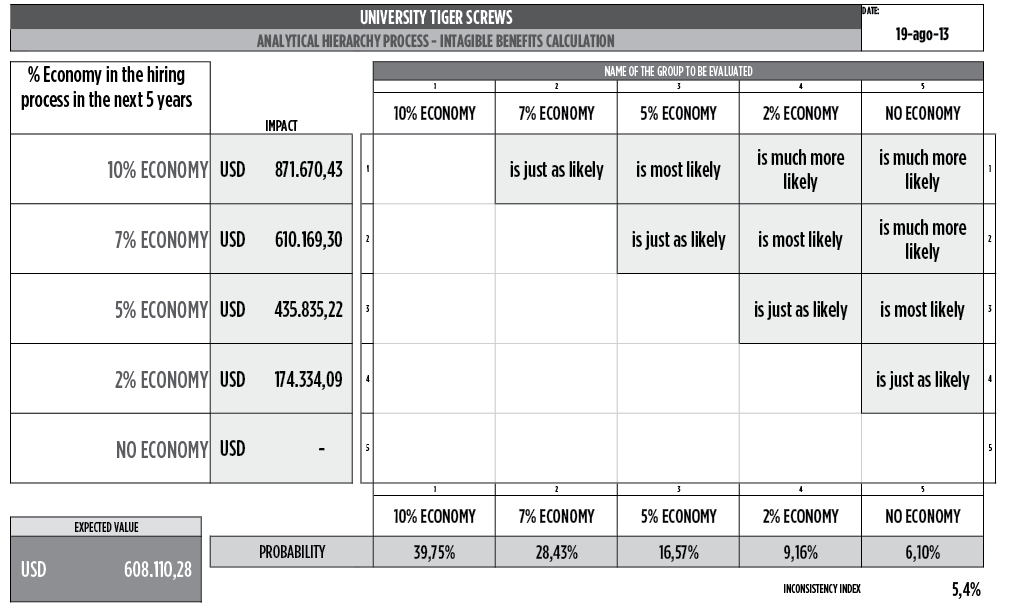 Exhibit 6 – Example of the use of AHP to estimate the Expected Value of the benefit of a project
The main output of this project is an updated list of projects including the estimated financial benefits.
Categorize Projects (Optional)
For organizations with a wide range of projects, the categorization of projects could add value in the analysis and stratification of efforts (Exhibit 7).
This optional process group the projects into different categories (Exhibit 8) like
- Departments
- Risk
- Value
- Sponsoring group
- Geographic location
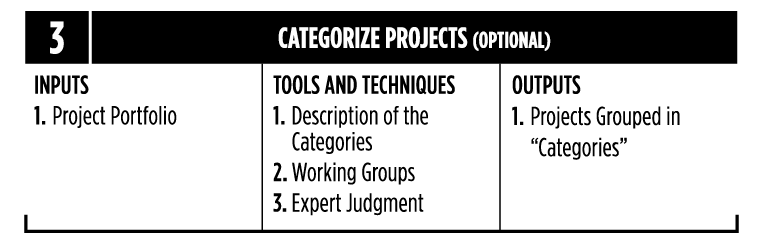 Exhibit 7 – Categorize Projects
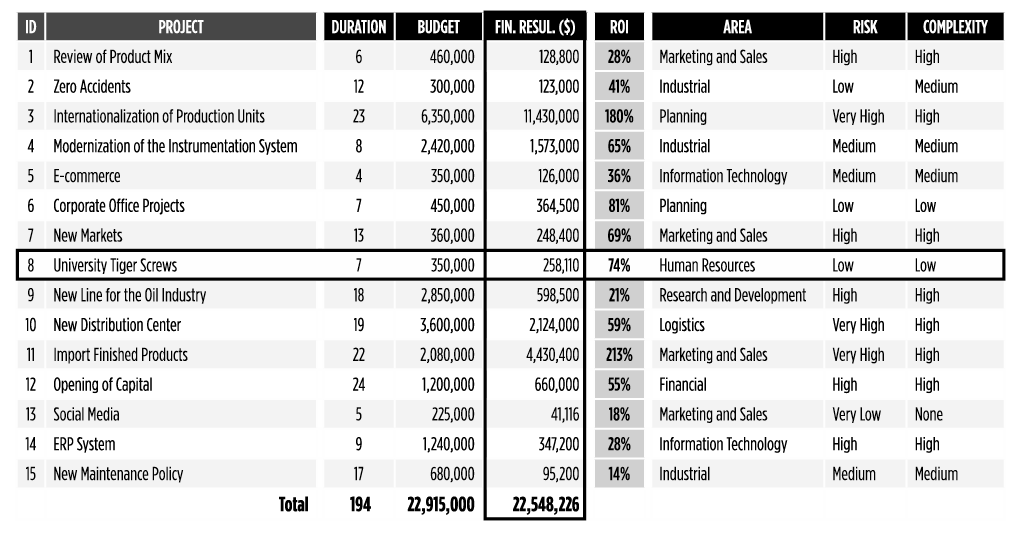 Exhibit 8 – Example of a categorized list of projects with the calculated benefits highlighted
Data Distribution Profile
The Data Distribution Profile aims to determine the best “risk profile” of the portfolio to archive the benefits and it contains the process Determine Optimistic, Most Likely and Pessimistic Profile for Schedule, Investments and Results.
Using market research, historical information from previous projects and benchmarking, the objective of this process is to define the optimistic, pessimistic and most likely scenarios for the duration, costs and financial results of each project (Exhibit 9).
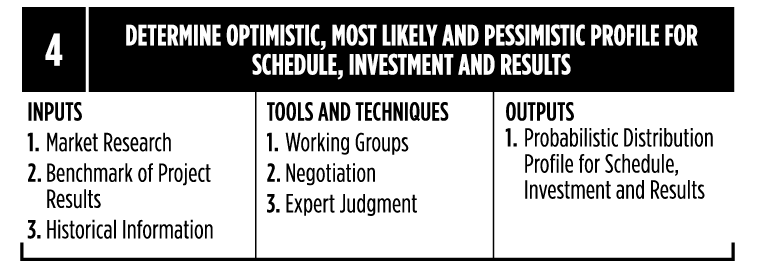 Exhibit 9 – Determine Optimistic, Most Likely and Pessimistic Profile for Schedule, Investment and Results
Different external sources can be used to support the decision as follows
- Standish Group Chaos Manifesto (STG, 2013)
- The IPA Institute Database of Capital Projects (IPA, 2013)
- PMI Pulse Report (PMI, 2013)
- Reports and researches from management consulting companies
This process requires a lot of negotiation to set the right thresholds for the project without being biased by individuals with over optimistic or over pessimistic behaviors.
The determination of the profiles can be done considering that the project duration, costs and financial results follow the same distribution (Exhibit 10) or a different set of distributions for each element.
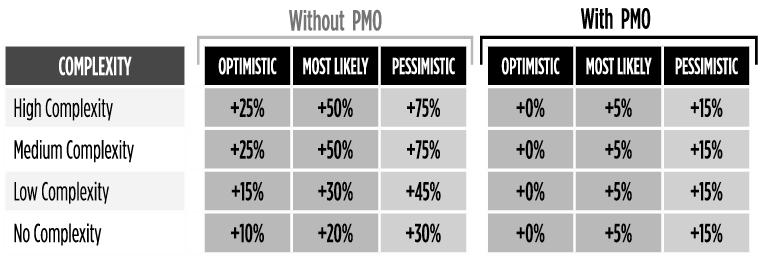 Exhibit 10 – Example of probabilistic forecasting based on project complexity level. In this case, a high complexity project with a value of $1,000,000 will cost between $1,250,000 and 1,750,000 without PM support and $1,000,00 and 1,150,000 with proper PM support.
Simulation
The Simulation group describes the process associated with the Monte Carlo simulation of the duration of the projects in the portfolio, associated costs and financial results.
“Monte Carlo” was a nickname of a top-secret project related to the drawing and to the project of atomic weapons developed by the mathematician
John von Neumann (POUNDSTONE, 1993). He discovered that a simple model of random samples could solve certain mathematical problems which couldn’t be solved up to that moment.
The simulation refers, however, to a method by which the distribution of possible results is produced from successive recalculations of project data, allowing the development of multiple scenarios. In each one of the calculations, new random data is used to represent a repetitive and interactive process. The combination of all these results creates a probabilistic distribution of the results (Exhibit 11).
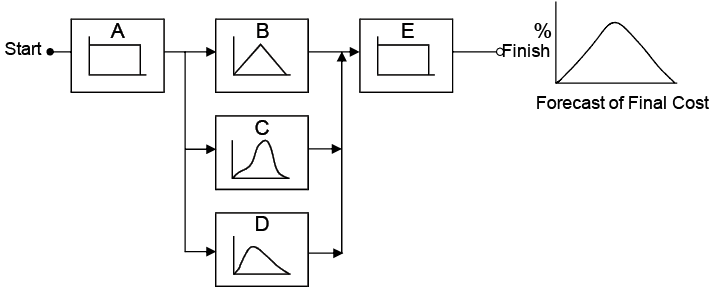
Exhibit 11 – Construction of model of distribution of costs and activities or work packages making up a final distribution from random data of the project (PRITCHARD, 2001).
The feasibility of outcoming distribution relies on the fact that, for a high number of repetitions, the model produced reflects the characteristics of the original distribution, transforming the distribution into a plausible result for analysis. The simulation can be applied in schedules, costs and other project indexes.
The Simulation group is divided in the following processes
- Simulate Portfolio of Projects
- Identify Gains in Schedule, Investment and Results with the Implementation of the PMO
Simulate Portfolio of Projects
This is process is responsible for the simulation of the schedule gains, investment savings and improvements of financial results (Exhibit 12).
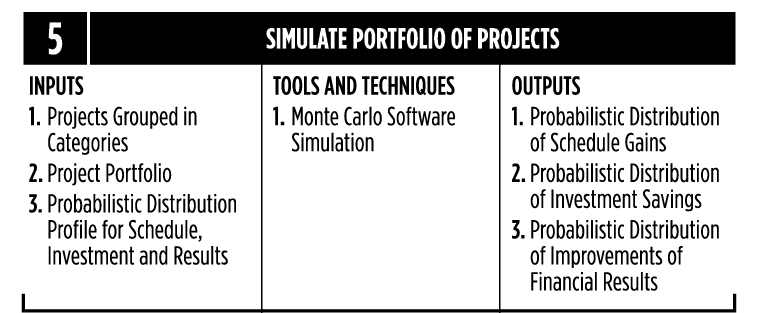 Exhibit 12 – Simulate Portfolio of Projects
The simulation is produced using simulation software and the results are a range of improvements in duration, budget and financial results with their respective confidence level (Exhibit 13, 14 and 15).
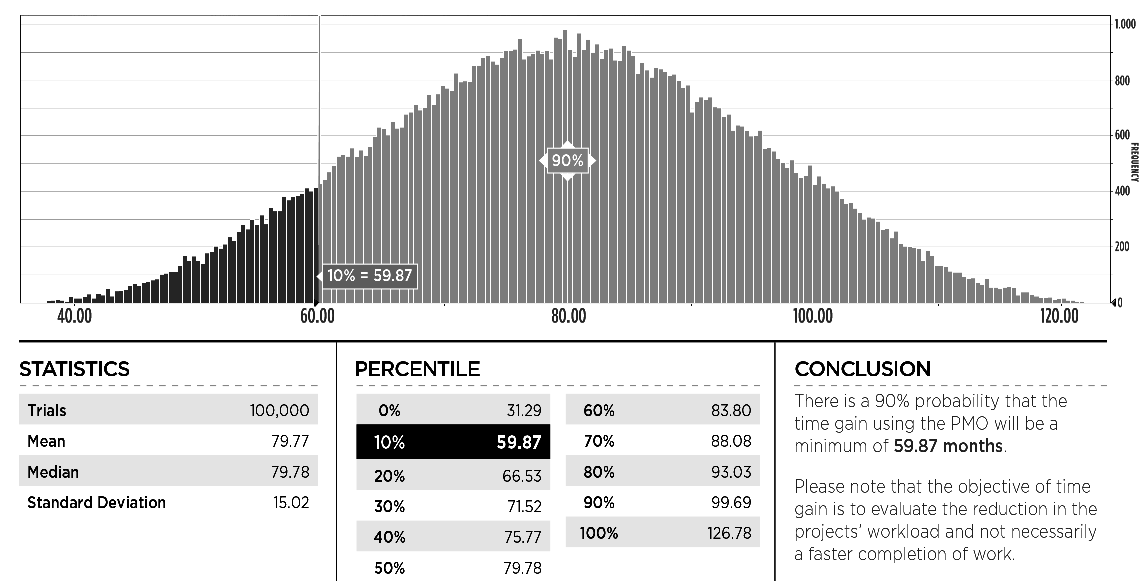 Exhibit 13 – Example of simulation output for the savings in the total time of the projects for using the PMO. In this case there is a 90% confidence that the savings will be above 59,87 months.
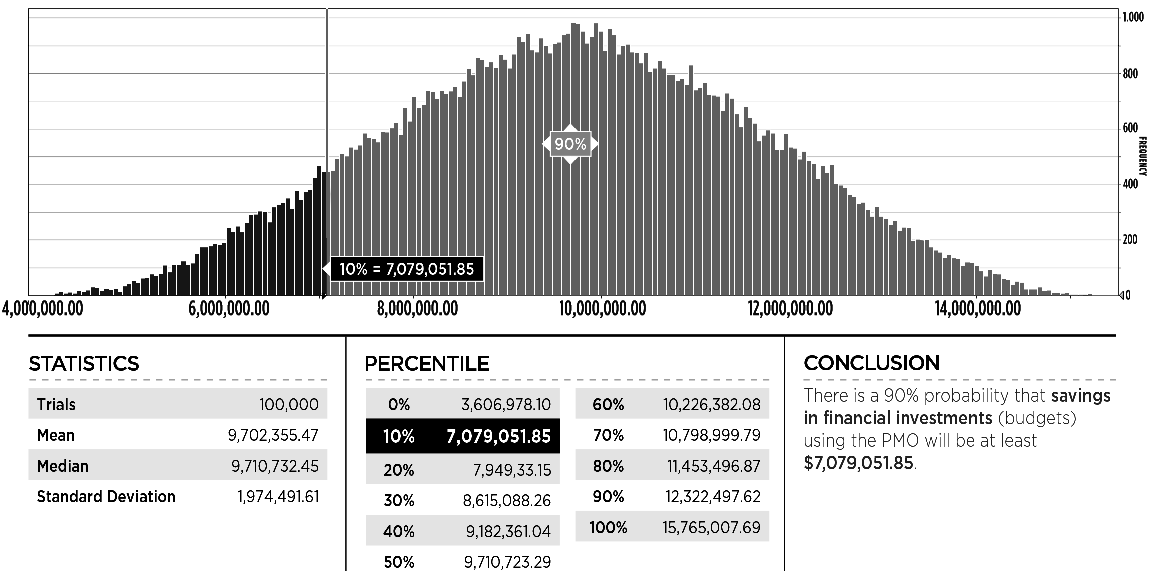 Exhibit 14 – Example of simulation output for the savings in the budget of the projects for using the PMO. In this case there is a 90% confidence that the savings will be at least 7,079,051.85 months.
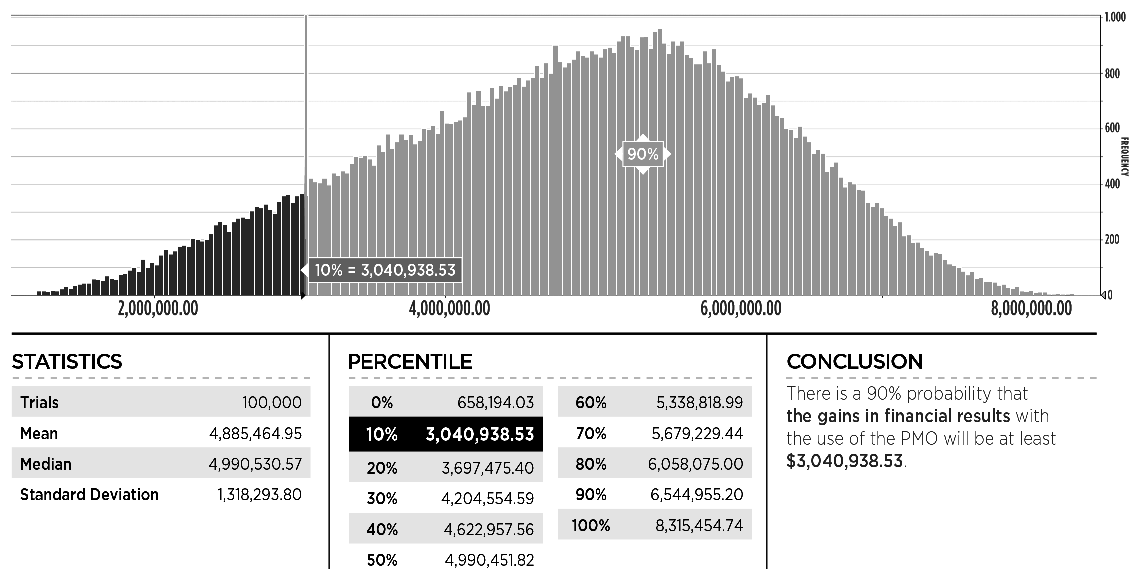 Exhibit 15 – Example of simulation output for the gains in financial results of the projects for using the PMO. In this case there is a 90% confidence that the savings will be at least 3,040,938.53 months.
Identify Gains in Schedule, Investment and Results with the Implementation of the PMO
After the simulation is concluded, the results are collected for a predefined confidence level in order to identify the measurable improvements (Exhibit 16 and 17).
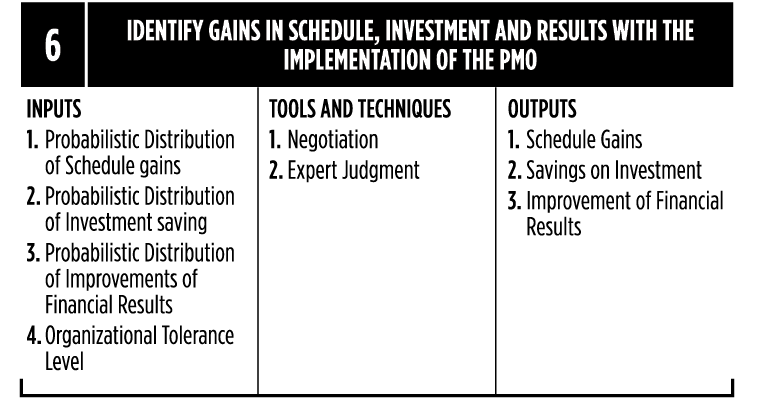 Exhibit 16 – Identify Gains in Schedule, Investment and Results with the Implementation of the PMO
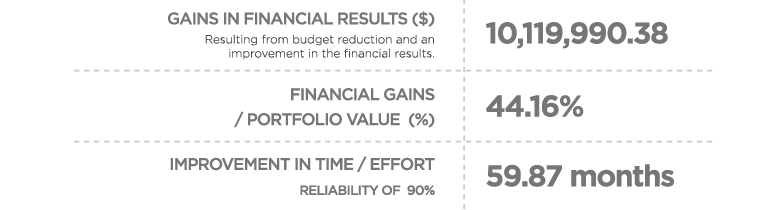 Exhibit 17 – Example of gains based on the simulation results (Exhibit 13, 15 and 15)
Investments in the PMO
The other aspect that must be considered when evaluating the ROI of a project implementation is to calculate the amount of costs the organization will incur to create and maintain the Project Office.
Different costs can be associated with the PMO (AUBRY, HOBBS, MÜLLER & BLOMQUIST, 2010). The most common elements are
- Personal cost
- Software and hardware
- Advisory services
- Training
- Others
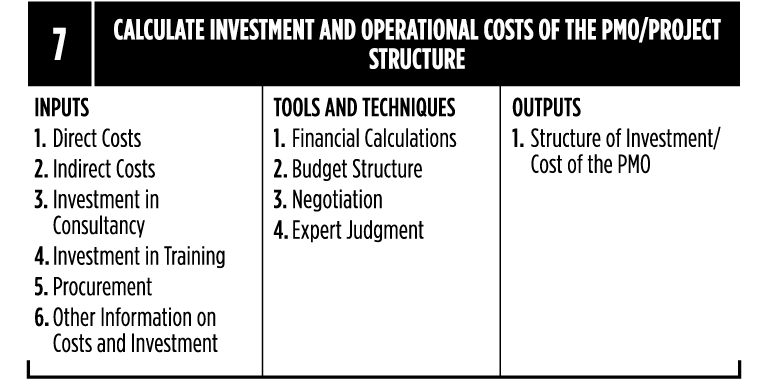
Exhibit 18 – Calculate Investment and Operational Costs of the PMO/Project Structure
The main output of this process is the total cost of the PMO setup and operation for a predefined time frame (Exhibit 19).
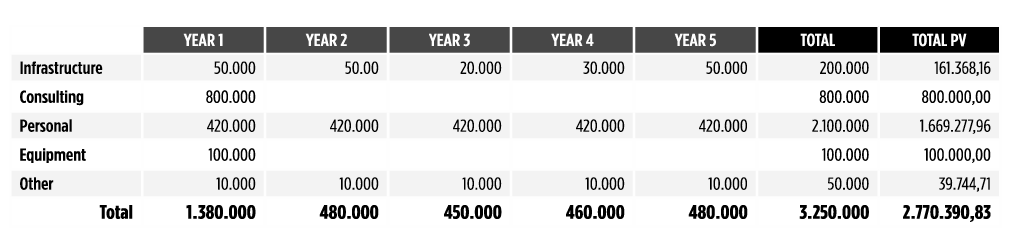 Exhibit 19 – Example of a PMO Setup and operation cost in a 5 (five) year time frame. All values should be adjusted to Present Value
Influence of the PMO in the Results
Based on the studies discussed in the step 4 of the process, it is important to highlight that not all benefits and positive results exclusively stem from the very existence and operation of the PMO. Many other external factors can benefit from those results and are beyond the control of the project manager and his/her team.
Some examples of benefit / dis-benefit drivers not related to project management implementations are (UK CABINET OFFICE, 2011)
- External economic factors like currency exchange rate, interest rates
- Market changes
- Changes in the legislation
- Changes in the senior leadership
- Others
In this process (Exhibit 20), it is proposed the use of the Analytical Hierarchy Process (AHP) to compare the likelihood of benefits coming from the PMO, in comparison with other sources of benefits (SAATY, 1980 and VARGAS, 2010).
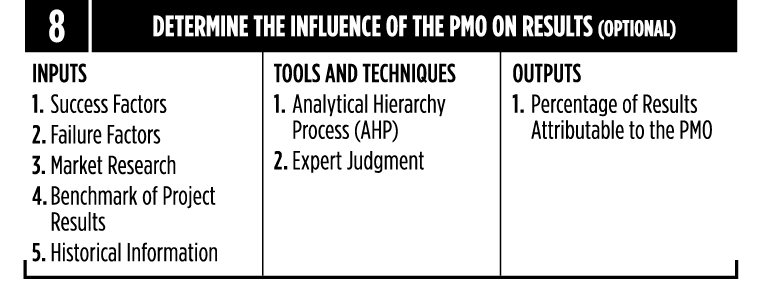 Exhibit 20 – Determine the Influence of the PMO on Results
The output of this process is the weight of the PMO in relationship with other sources of benefits (Exhibit 21).
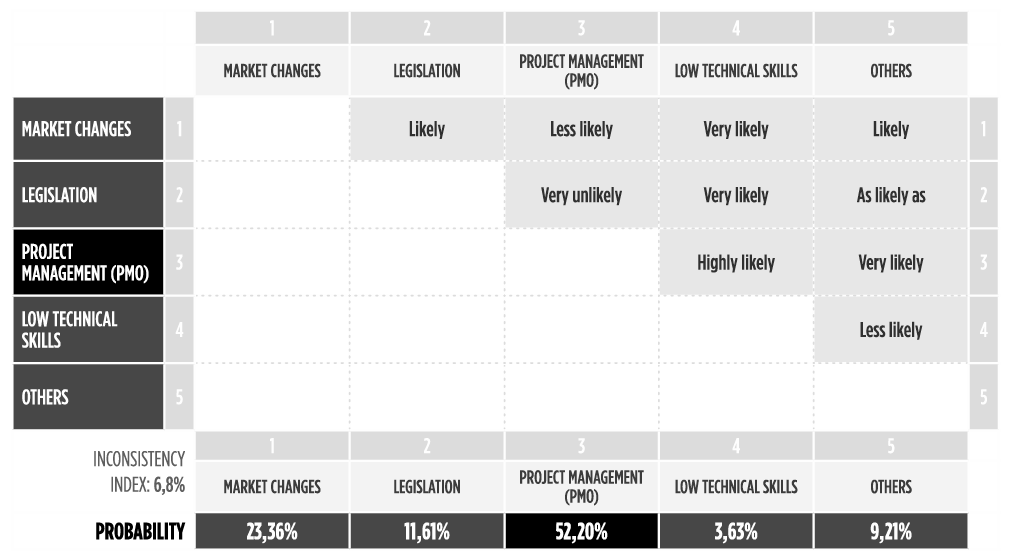 Exhibit 21 – Example of AHP comparing different sources of benefits with project management implementation. In this case, it is suggested that 52,2% of the benefits could be justified by the setup and operations of a PMO
RESULTS
The final group of process intends to calculate the return on investment and also analyze and discuss the final results.
The Results group is divided in the following processes
- Calculate the Return on Investment (ROI) of the PMO
- Analyze Final Results
Calculate the Return on Investment (ROI) of the PMO
This process compare the results obtained in the simulation and compare them with the investments related to the PMO and the percentage of results attributable to the PMO (Exhibit 22).
 Exhibit 22 – Calculate the Return on Investment (ROI) of the PMO
The output of this process is the calculated return on investment with complementary information (Exhibit 23).
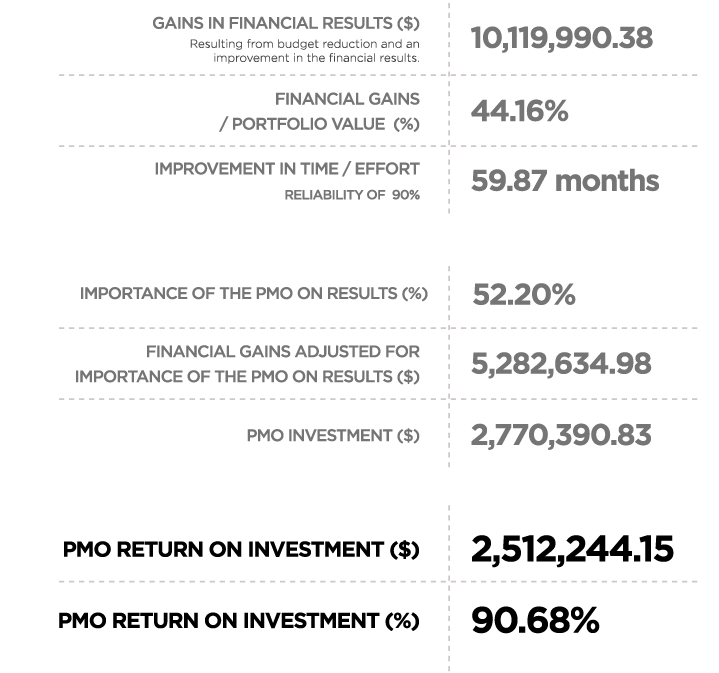
Exhibit 23 – Example of financial calculation based on the simulation results and the cost / relevance of the PMO in the results.
Analyze Final Results
After receiving the final ROI Report, working groups and the PMO sponsoring group need to meet in order to analyze and discuss the results to make the final decision (Exhibit 24).
 Exhibit 24 – Analyze Final Results
Conclusions
The proposed model is a “master line” of the value calculation and can thus be customized and adapted to different scenarios. It is important to highlight that this model is a simplification of very complex environment, where different perceived values can provide different directions to different stakeholders.
In order to avoid resistance and criticism during the simulation of intangible results, it is important to do this work in teams to avoid personal biases in the process.
Finally, it important to understand the challenge of determining ROI without knowing which projects are selected and the strategy that supports them. A project office that takes care of several different multi million projects is a very different effort from a project office that has simple work packages to be controlled.
References
AUBRY, M., HOBBS, B., MÜLLER, R. & BLOMQUIST, T (2010). Identifying Forces Driving PMO Changes. Project Management Journal, Vol. 41, No. 4, pp. 30-45, 2010. Newtown Square: Project Management Institute.
EIU (2009). Closing the Gap - The Link Between Project Management Excellence & Long-Term Success. London: Economist Intelligence Unit.
HUBBARD, D. (2010). How to Measure Anything: Second Edition. Hoboken: John Wiley & Sons.
IPA (2013). Research as a Foundation. Ashburn: Independent Project Analysts. Available at https://www.ipaglobal.com/services/research/
KWAK, Y.H. & IBBS, C.W. (2000). Calculating Project Management’s Return on Investment. Newtown Square: Project Management Journal, Volume 31, Issue 2. Available at https://www.pmi.org/learning/library/calculating-pm-return-on-investment-5269
PHILIPS, J. J. & PHILIPS, P. P. (2007). Show me the Money: How to Determine the ROI in People, Projects and Programs. San Francisco: Berrett-Koehler Publishers.
PMI (2013). Pulse Report of the Profession. Newtown Square: Project Management Institute. Available at http://www.pmi.org/Knowledge-Center/Pulse.aspx
PMI (2013). The Project Management Body of Knowledge: Fifth Edition. Newtown Square: Project Management Institute.
POUNDSTONE, W (1993). Prisoner’s Dillema. Flushing: Anchor Publishing Group.
PRITCHARD, C. L. (2001). Risk Management: Concepts and Guidance. 2ª Ed. Arlington: ESI International.
SAATY, T. L (1980). The Analytic Hierarchy Process. New York: McGraw-Hill International.
SAATY, T. L. (2009). Extending the Measurement of Tangibles to Intangibles. International Journal of Information Technology & Decision Making, Vol. 8, No. 1, pp. 7-27, 2009. Available at SSRN: https://papers.ssrn.com/sol3/papers.cfm?abstract_id=1483438.
STG (2013). The Chaos Manifesto. Boston: The Standish Group. Available at https://standishgroup.myshopify.com
UK CABINET OFFICE (2011). Managing Successful Programmes: Forth Edition. London: The Stationery Office.
VARGAS, R (2004). Earned Value Probabilistic Forecasting Using Monte Carlo Simulation. Washington: AACE - Association for Advancement of Cost Engineering 48th Annual Meeting.
VARGAS, R. V. (2010). Using Analytical Hierarchy Process to Select and Prioritize Projects in Portfolio Management. Dallas: PMI Global Congress North America. Available at https://ricardo-vargas.com/articles/analytic-hierarchy-process/.
PMO (Project Management Office) , ROI , Return on Investment